Blog
There is a general perception that firms pay less tax than the statutory tax rates would suggest, even after accounting for profit shifting and evasion. Indeed, tax incentives such as credits, income exemptions and reduced rates can create a wedge between statutory and effective tax rates. We examine how tax incentives lower effective tax rates and how they vary with firm size. This is important because tax incentives generate a government revenue loss, can distort firms’ production, and may exacerbate inequality. We also use our estimates of effective tax rates to assess the potential impact of a Global Minimum Tax.
We construct effective tax rates (ETRs) at the firm level, using full-population corporate tax records for 13 countries with varied income levels and population sizes, in Africa (Ethiopia, Eswatini, Rwanda, Senegal, Uganda), Latin America (Costa Rica, Dominican Republic, Ecuador, Guatemala, Honduras, and Mexico), and Eastern Europe (Albania and Montenegro). Our ETR measure is defined in a consistent way across countries, as a firm’s corporate tax liability divided by its net profits (total revenue minus standard production and financing costs). Differences in ETRs across firms are hence due to policy choices (tax incentives) and not due to differences in firms’ profitability.
When plotting the ETR by firm size (revenue) quantiles, we observe an inverted U-shape pattern. The ETR increases with firm size until about the 90th percentile and then falls for the largest firms. A firm in the top 1% of size faces an ETR that is three percentage points lower than a firm in the top 10%. Small firms face lower ETRs than mid-sized firms due to reduced statutory tax rates and a higher propensity to register losses. The drop in the ETR at the top is due to tax credits, which are disproportionately used by large firms.
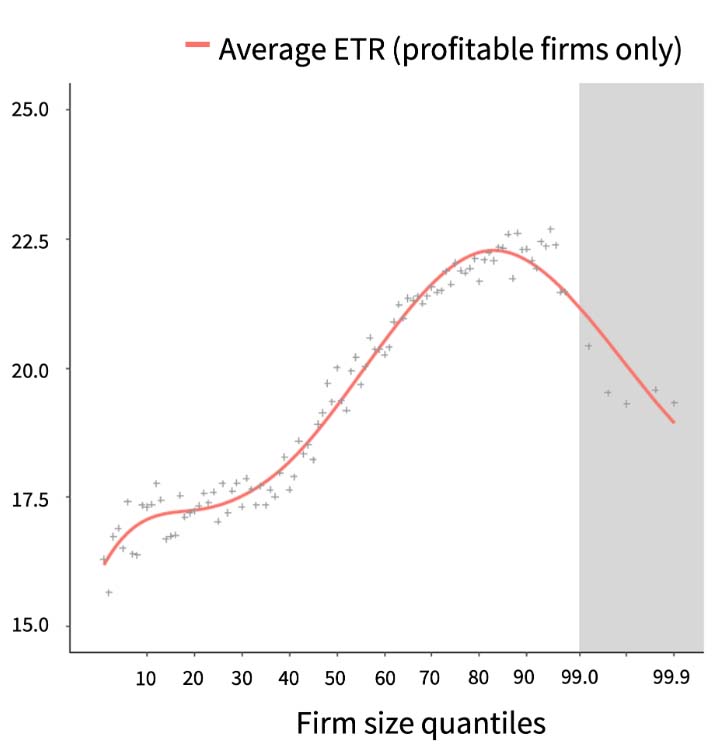
This figure plots the effective tax rate (ETR) by firm size (revenue) quantiles, averaged across the 13 countries in our data. For each quantile bin, we first average the ETR across firms in each country, and then average across countries to give equal weight to each country. The quantiles correspond to percentiles between the 1st and 89th percentile (white area), and to 0.2% bins between the 99th and 100th percentiles (grey shaded area). The orange fitted line is based on a cubic smoothing spline.
The variation in ETRs with firm size is large and systematic, and hence likely to distort to distort firm choices and affect aggregate output. The drop in ETRs among the largest firms also implies a substantial scope for a global minimum tax to raise revenue. In the median country in our sample, 30% of the biggest 1% of firms pay an ETR below 15%. Lifting their ETR to 15% would increase revenue by 27%.
More work is needed to examine the welfare impact of the ETR-firm-size pattern we document, taking into account potential benefits of tax incentives for investment and innovation. Another open question is why large firms benefit disproportionately from tax incentives.
This blog was first published by the Stone Centre at UCL, and is reproduced here with kind permission.
Published on: 14th March 2023
Print